Throughout its development, BNB’s price movements have closely reflected real-world utility growth, ranging from the launch of BSC, the rise of DeFi and GameFi, to the ecosystem upgrades such as Greenfield and opBNB.
This analysis breaks down BNB’s full price history from 2017–2025, highlights the key catalysts behind each market cycle, and outlines long-term trends that continue shaping BNB as one of the core infrastructure assets in Web3.

| Key Takeaways – BNB’s price action mirrors the growth of the Binance ecosystem, evolving from a fee-discount token into a core Web3 infrastructure asset. – The strongest bull cycles occurred after major technological launches such as Binance Smart Chain and opBNB. – BNB proved highly resilient during market-wide crises like Terra, 3AC, Celsius, and FTX. – Institutional capital, especially post-ETF approvals in 2024–2025, significantly strengthened BNB’s long-term market position. |
BNB Price History Overview (2017–2025)
| Year | Approx. Price Range | Major Events | Impact on BNB |
|---|---|---|---|
| 2017 | $0.10 → $8.63 | Binance ICO, exchange launch, China ICO ban, global expansion, BTC $20K | Strong early adoption driven by fee utility + rapid exchange growth |
| 2018 | $4.13 → $12.99 | API hack attempt, Binance Chain announced, expansion to Uganda & Jersey, quarterly burns | Ecosystem foundations strengthened despite bear market |
| 2019 | $5.38 → $39.54 | Launchpad boom, Binance DEX, staking, travel card integration | BNB became one of the top-performing altcoins due to expanding utility |
| 2020 | $6.5 → $39.7 | COVID crash, BTC halving, BSC launch | BSC became a historic catalyst, turning BNB into a multi-chain asset |
| 2021 | $35.1 → $690.87 | DeFi/GameFi boom on BSC, market corrections, China ban, BTC ATH | Massive growth in demand for BNB as gas + ecosystem token |
| 2022 | $184.06 → $533.59 | Terra/LUNA collapse, Celsius/3AC failures, BSC bridge hack, FTX collapse | High volatility but BNB stayed resilient relative to the market |
| 2023 | $202.99 → $350 | SEC lawsuit, bearish signals, CZ steps down, DOJ settlement | Defensive year with stabilized price range |
| 2024 | $287.6 → $793.2 | Bitcoin ETF approvals, listing controversy, SEC lawsuit 2, AI market optimism | Institutional liquidity returned; BNB regained upward momentum |
| 2025 | New ATH: $1,370.98 | Strong ETF inflows, opBNB + Greenfield expansion, altseason | BNB entered strongest growth phase since 2021; ecosystem-driven ATH |
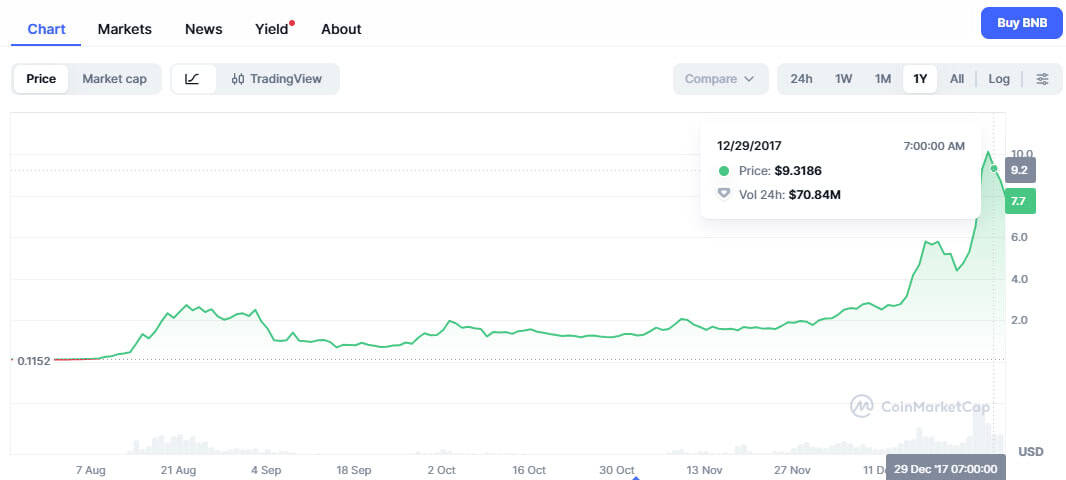
BNB price chart in 2017
BNB debuted in 2017, one of the most explosive growth phases in crypto history. Launched at an ICO price of $0.10, BNB quickly gained traction due to its clear and practical utility: trading-fee discounts on the rising Binance exchange.
- ATH 2017: $9.3186
- ATL 2017: $0.0961
- Growth: ~+9,600% from ICO
- Primary Catalysts: Exchange utility, global user growth, high trading volumes
Key Events in 2017
- 25/07/2017: Binance ICO launched, raising $15 million
- A highly successful ICO, which gave Binance strong financial support.
- BNB initially enjoyed visibility due to well-defined utility: trading fees were lower.
- 14/08/2017: Binance officially launched
- It debuted as a fast-performing exchange with low fees and very strong UX.
- BNB started to be utilized in real trading and became one of the most successful utility tokens.
- 04/09/2017: China banned ICOs and crypto trading
- The market received it badly, and many projects were disrupted.
- Despite setbacks, Binance and BNB sustained strong international investor interest.
- 29/10/2017: Binance left China and moved its headquarters abroad
- Binance avoided regulatory risks and went on to expand globally.
- The move strengthened long-term confidence in the exchange.
- 12/2017: Bitcoin topped $20 000, altcoins also exploded
- Massive FOMO flooded into the market and drove trading volumes upwards.
- As Binance developed to become one of the fastest-growing exchanges, BNB benefited greatly.
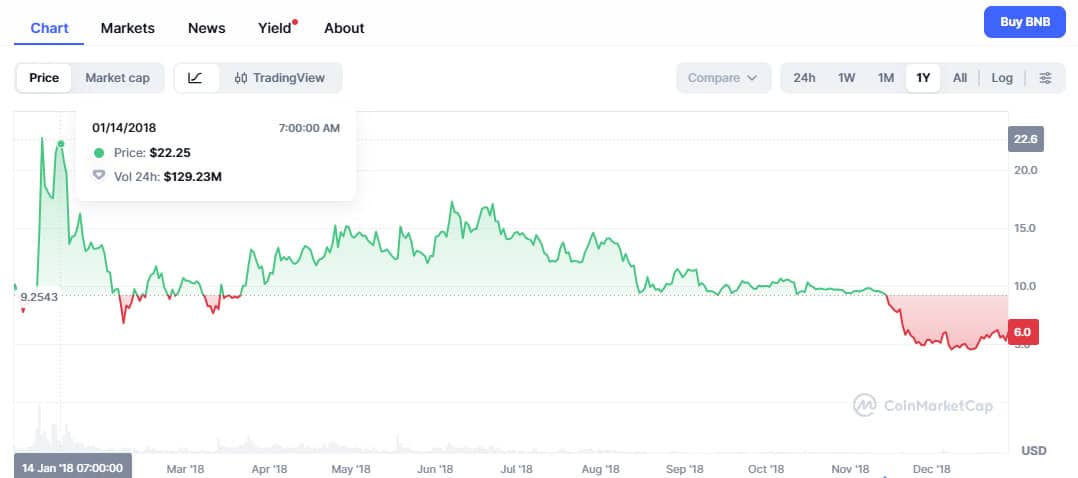
BNB price chart in 2018
2018 marked a harsh crypto winter, but BNB held up better than most altcoins thanks to steady quarterly burns and ongoing infrastructure development.
While Bitcoin and most altcoins saw significant price declines, BNB proved more resilient thanks to consistent quarterly burns and ongoing infrastructure development. BNB traded between $4.13 and $12.99, outperforming many major assets during one of the harshest crypto winters.
- ATH 2018: $22.25
- ATL 2018: $4.13
- Primary Catalysts: Binance Chain announcement, burns, global expansion
- Market Condition: Post-2017 crash bear market
Key Events in 2018
- 07/03/2018: Binance API hack attempt
- Attackers manipulated some user accounts to buy VIA.
- Binance had suspended trading and provided full compensation.
- This quick response fortified Binance’s reputation of protection for its users.
- 13/03/2018: Binance announced plans for Binance Chain
- Implemented blockchain infrastructure for token issuance and decentralized trading.
- This was the first major step toward today’s BNB Chain (BSC).
- The market saw this as a strong strategic expansion into blockchain development.
- Apr–Oct 2018: Binance carried out quarterly BNB burns.
- Burns continued unwaveringly with Binance’s revenue.
Reinforced long-term confidence in the deflationary model of BNB. - One of the main competitive advantages BNB has over other exchange tokens.
- Burns continued unwaveringly with Binance’s revenue.
- Jun–Aug 2018: Aggressive expansion into new regions at Binance
- Launched Binance Uganda in June to expand into Africa.
- Launched Binance Jersey in August to serve EUR–GBP fiat gateways.
- Global expansion showcased Binance’s long-term vision despite the bear market.
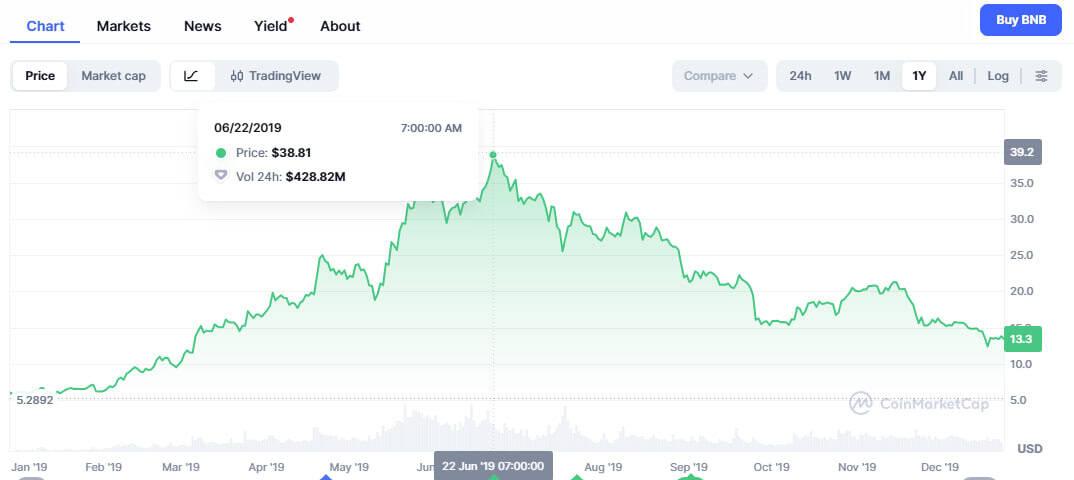
BNB price chart in 2019
2019 was a pivotal year where BNB evolved beyond a fee token into a multi-utility ecosystem asset. This year saw the launch of Binance DEX, staking features, early fiat gateways, and the explosive rise of Binance Launchpad, all of which significantly boosted organic demand for BNB.
- ATH 2019: $39.54
- ATL 2019: $5.38
- Primary Catalysts: Launchpad boom, DEX launch, staking, payments adoption
- Market Condition: Early recovery phase after the 2018 bear market
Key Events in 2019
- January 2019 : Binance Jersey goes live
- Expanded into the EU with EUR-GBP fiat trading support.
- Increased regulatory legitimacy, and access to traditional users.
- An important landmark in global growth.
- April 2019: Binance Launchpad was behind several successful IEOs, including MATIC.
- It has therefore attracted massive investment interest from all over the world.
- Established IEOs as the leading trend in 2019.
- Demand for BNB surged because of the participation requirements on Launchpad.
- June 2019: Binance DEX launched on Binance Chain
- A decentralized exchange built directly by Binance.
- Increased on-chain use cases for BNB.
- Positioned BNB as a blockchain ecosystem asset, not just a fee token.
- September 2019 – Binance launched staking services.
- Supported staking for ALGO, XLM, and others.
- Expanded into crypto financial services.
- Attracted long-term users through passive income products.
- November 2019: Binance partnered with TravelbyBit to launch a crypto travel card.
- Visa-powered crypto payments were enabled globally.
- Expanded real-world use cases for crypto.
- Strengthened Binance’s presence in commercial payments.
- December 2019: 9th BNB burn completed
- Taken over 2.2 million BNB out of circulation.
- Reinforced the token’s long-term deflationary model.
BNB price chart in 2020
2020 was one of the most important foundational years for BNB. Despite the COVID crash, BNB recovered strongly, and the launch of Binance Smart Chain (BSC) transformed it into the gas token of a full smart-contract ecosystem.
- ATH 2020: $39.7
- ATL 2020: $6.5
- Key Catalysts: BSC launch, Bitcoin halving, market recovery
- Market Condition: COVID crash → V-shaped recovery → new bull cycle
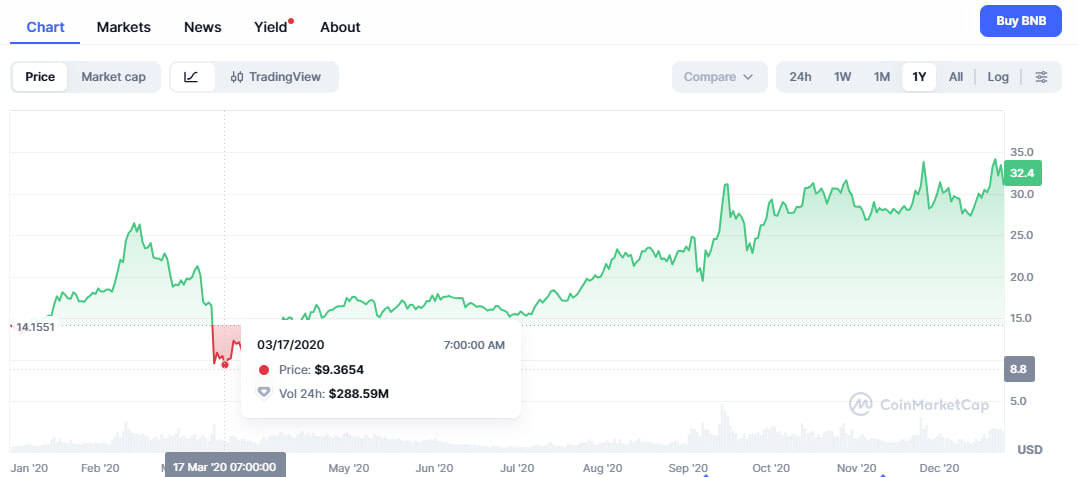
Key Events in 2020
| Date | Event | Description | Impact on BNB |
|---|---|---|---|
| Mar 2020 | COVID-19 “Black Thursday” Crash | One of the deepest market crashes in crypto history | BNB dropped but recovered faster than most altcoins, showing strong resilience |
| May 2020 | Bitcoin Halving | BTC block reward cut from 12.5 → 6.25 BTC | Improved overall crypto market sentiment; BNB gradually rebounded |
| Sep 2020 | Binance Smart Chain (BSC) Launch | EVM-compatible smart contract chain launched | Historic milestone; BNB gains major utility as gas; ecosystem growth accelerates |
| Oct 2020 | Quarterly BNB Burn | Over 2.25M BNB burned | Reinforced BNB’s deflationary model during market recovery |
| Dec 2020 | Market Recovery & BTC Rally | Bitcoin headed to new all-time highs | Capital flowed into altcoins, boosting BNB demand |
BNB price chart in 2021
2021 was the strongest growth year in BNB’s history prior to 2025. The explosive expansion of Binance Smart Chain (BSC) turned BNB into one of the most demanded assets in the entire crypto market.
As DeFi, GameFi, NFTs, yield farming, and on-chain activity surged, BSC briefly became the most active blockchain in the world, with transaction volumes surpassing Ethereum at certain points.
- ATH 2021: $690.87
- ATL 2021: $35.1
- Key Catalysts: BSC adoption, DeFi/GameFi growth, market-wide bull cycle
- Market Condition: Massive bull run → mid-year correction → recovery into Q4
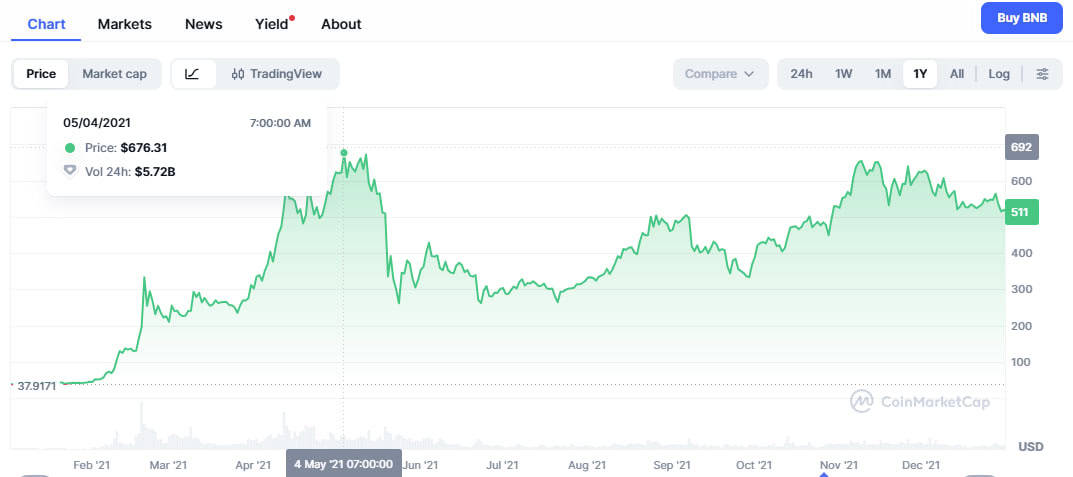
Key Events in 2021
- February 2021: BSC saw explosive growth.
- It became the world’s fastest-growing DeFi ecosystem.
- Massive increase in users, transactions, and new projects on DeFi.
- Demand for BNB soared because of gas fees and staking.
- May 2021: Market-wide correction
- After such a strong rally, the market now had a sharp downturn.
- BNB fell in price but kept high liquidity and user activity.
- A natural cool-down after a rapid early-year growth.
- September 2021: China strengthened its crypto ban
- China reiterated a total ban on crypto-related activities.
- The markets all around the world reacted negatively.
- BNB faced a short-term pressure but recovered with the momentum of BSC.
- November 2021: Market recovery and new BTC all-time high
- Sentiment improved, liquidity returned to major assets.
- BNB approached its yearly highs as BSC continued to expand.
BNB price chart in 2022
2022 was one of the most turbulent years in crypto history. The collapse of major institutions such as Terra (LUNA/UST), Celsius, Voyager, 3AC, and FTX triggered a deep liquidity crisis across the industry.
Despite extreme market stress, BNB remained one of the most stable large-cap assets, maintaining strong on-chain activity and staying within the top market rankings.
- ATH 2022: $533.59
- ATL 2022: $184.06
- Key Catalysts: Market crashes, bridge hack, exchange failures, liquidity fear
- Market Condition: Severe bear market + systemic failures across crypto
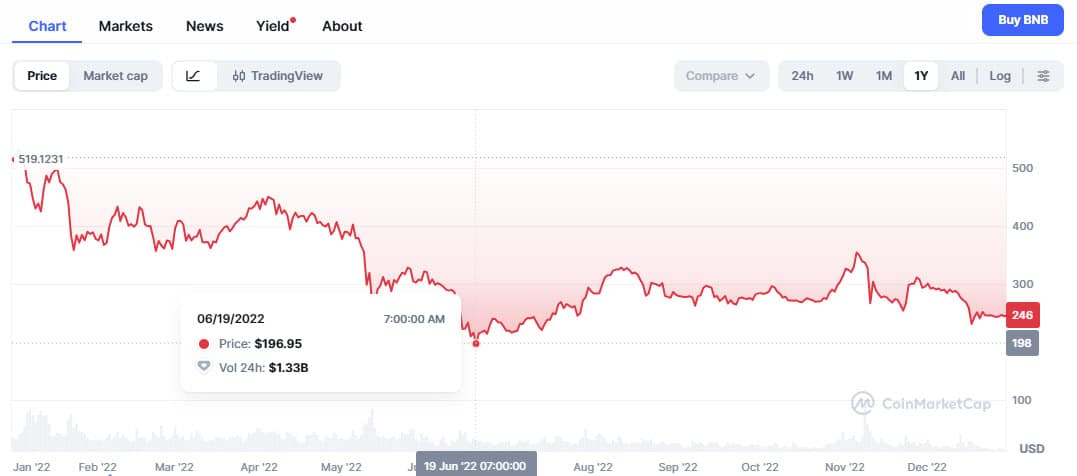
Key Events in 2022
- May 2022: Terra’s LUNA and UST collapsed.
- One of crypto’s biggest collapses triggered industry-wide contagion.
- Investor confidence evaporated, as did the prices of altcoins like BNB.
- Marked the beginning of failures that would then snowball.
- June 2022: Celsius, Voyager, and 3AC collapsed
- Major lending platforms and hedge funds went bankrupt.
- Triggered panic selling and mass liquidations.
- BNB saw heavy mid-year selling pressure.
- October 2022: BSC Token Hub bridge hack ($586M)
- One of the worst attacks in the year.
- Binance froze BSC to limit the damage.
- Security concerns created short-term fear around the ecosystem.
- November 2022: FTX collapsed
- A historic exchange failure that damaged industry trust.
- Strictly negative sentiment across crypto.
- BNB was affected psychologically because Binance is the chief rival to FTX.
- December 2022: $12B withdrawn from Binance over two months
- Triggered by concerns about transparency following the collapse of FTX.
- Binance faced intense liquidity scrutiny.
- BNB remained under heavy pressure through year-end.
BNB price chart in 2023
Regulators intensified their efforts as the SEC sued Binance and CZ stepped down. Despite volatility and negative sentiment, BNB traded within a stable range. Binance’s settlement with U.S. authorities marked a shift toward long-term compliance.
- ATH 2023: $350
- ATL 2023: $202.99
- Market Condition: Regulatory pressure, reduced volatility, industry consolidation
- Key Catalysts: SEC actions, leadership change, settlement agreements
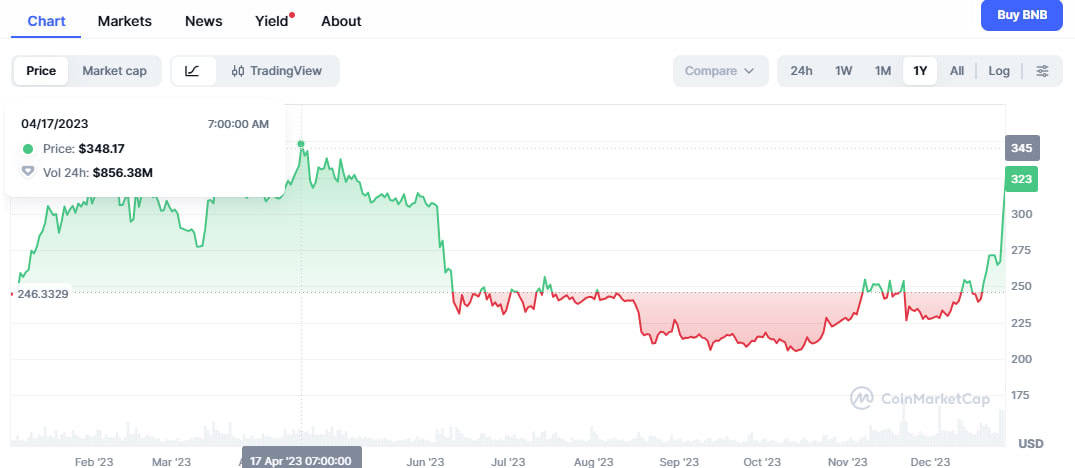
Key Events in 2023
- June 2023: The SEC sued Binance and its chief executive, Changpeng Zhao.
- Allegations included securities violations and operating without proper licensing.
- One of the most significant legal challenges Binance had faced.
- Created strong selling pressure on BNB throughout Q2.
- August 2023: Bearish technical signals appeared
- Daily MACD-H has shown a bearish crossover.
- RSI broke its long-term support trendline, a distribution signal.
- Analysts had warned that BNB has entered into an extended correction phase.
- November 2023: CZ resigned; Binance settled with the DOJ and CFTC
- CZ stepped down as CEO after U.S. legal settlements.
- Binance agreed to pay fines and adopt long-term compliance oversight.
- A shocking event for the community that put short-term pressure on BNB.
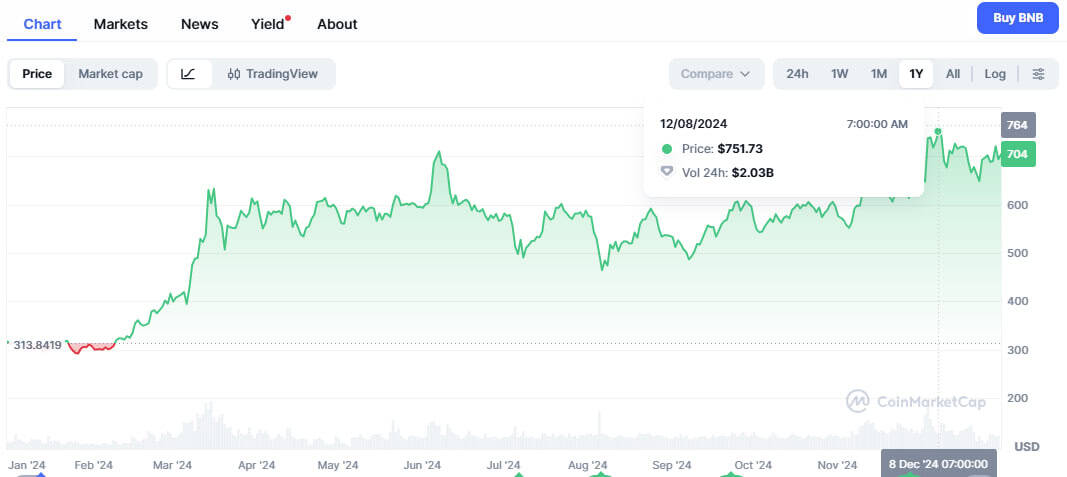
BNB price chart in 2024
2024 marked a major turning point for the entire crypto market as institutional capital re-entered the space following the approval of the first U.S. spot Bitcoin ETFs. BNB benefited from renewed optimism, increased liquidity, and the broader market recovery. Despite some regulatory tensions and listing controversies, BNB demonstrated strong upward momentum throughout the year.
- ATH 2024: $793.2
- ATL 2024: $287.6
- Market Condition: Institutional inflows, ETF-driven liquidity, improving sentiment
- Key Catalysts: Bitcoin ETF approvals, regulatory actions, AI-driven predictions
Key Events in 2024
- January 2024: SEC approved the first U.S. spot Bitcoin ETFs
- Included BlackRock, Fidelity, Ark Invest, VanEck, Invesco, 21Shares, among others.
- A historic milestone that unlocks large institutional inflows.
- Sentiment surged across all major altcoins, including BNB.
- February 2024: Binance revised listing procedures after RON insider-trading concerns
- RON’s listing concerns brought short-term market fear regarding transparency.
- Binance updated listing protocols in ways which reduce the chances of price manipulations.
- BNB saw temporary pressure due to uncertainty in sentiment.
- March 2024:The SEC has filed another lawsuit against Binance
- Allegations of securities violations in the U.S. market.
- Increased investor caution and heightened selling pressure.
- November 2024: AI-based models predicted strong upside for BNB
- AI predictions showed that BNB might have a year-end rally.
- Improved sentiment helped attract capital back to BNB.
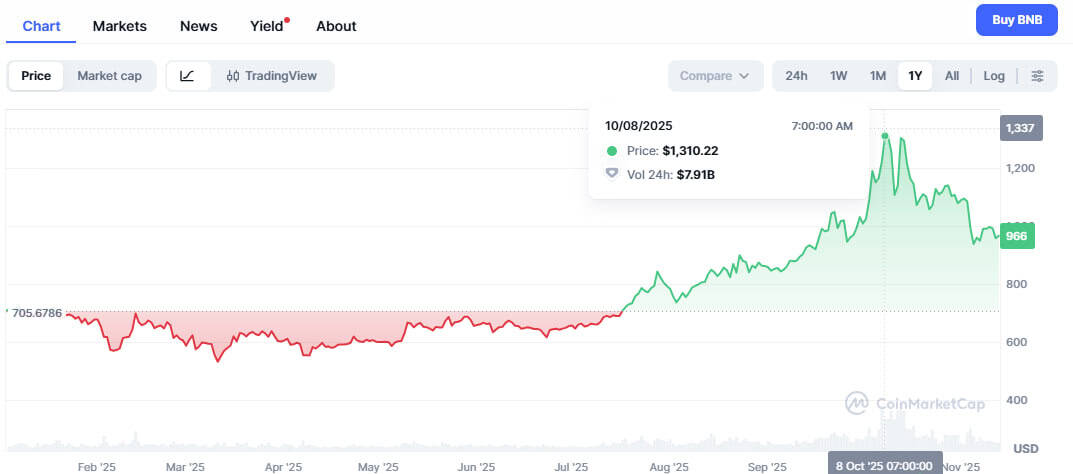
BNB price chart in 2025
2025 was the strongest year for BNB since the explosive 2021 cycle. Powered by massive ETF inflows, accelerating ecosystem growth, and major adoption of opBNB and Greenfield, BNB broke its previous records and reached a new all-time high of $1,370.98.
The year was defined by rapid expansion in Web3 infrastructure, rising institutional interest, and the return of a full-scale altseason, all contributing to sustained demand for BNB as a core utility asset across the BNB Chain ecosystem.
- New All-Time High (ATH): $1,370.98
- Market Condition: Strong bull cycle, institutional inflows, high on-chain demand
- Key Catalysts: opBNB adoption, Greenfield expansion, ETF-driven liquidity, altseason
Key Events
- Jan–Mar 2025: ETF inflows remained strong
- Bitcoin and Ethereum ETFs continued to attract net inflows.
- But institutional participation helped such blue-chip assets as BNB.
- Trading volumes rose significantly on both Binance and the BNB Chain.
- Apr–Jun 2025: BNB Chain expanded via opBNB and Greenfield
- Many Web3, SocialFi, and AI-crypto projects launched on opBNB.
- Greenfield attracted decentralized storage and data-economy applications.
- The use cases for BNB grew rapidly, increasing organic demand.
- Jul–Sep 2025: Altcoin season intensified
- The market entered a strong bullish phase, where the returns of several altcoins outweighed Bitcoin’s performance.
- BNB was among the top performers, backed by solid fundamentals.
- Long-term demand was supported by growth in B2B, gaming, and DeFi.
- October 2025: BNB reached a new ATH
- Institutional capital-driven, high on-chain demand, and expanding into a highly sought-after ecosystem.
- The largest milestone since the 2021 peak.
- Reinforced BNB’s position as a top-tier asset.
- Nov–Dec 2025: Market stabilized, BNB maintained positive momentum
- Profit-taking occurred but had limited impact due to strong on-chain usage.
- Institutions began viewing BNB as a critical Web3 infrastructure asset.
- BNB ended the year in a strong, sustainable uptrend.
Long-Term Insights
BNB’s long-term performance consistently tracks ecosystem expansion rather than market speculation. Each major upgrade such as BSC, opBNB, and Greenfield has historically resulted in meaningful increases in real utility. This pattern shows that BNB’s growth is fundamentally tied to adoption, not hype.
Periods of market stress including systemic failures like Terra, 3AC, and FTX demonstrated BNB’s resilience relative to other large-cap assets. While broad downturns impacted short-term sentiment, BNB maintained strong user activity and recovered quickly once stability returned. This reflects the strength of its underlying ecosystem.
As institutional participation continues rising and Web3 infrastructure matures, BNB is positioned as a long-term infrastructure asset rather than a short-term speculative token. Growth across scaling solutions, decentralized storage and cross-chain applications will likely sustain organic demand. This gives BNB a structurally strong outlook for future cycles.
Conclusion
BNB has emerged as one of the most robust and structurally sound assets in the crypto market. Through crashes, hacks, bans, lawsuits, and changes of leadership, it has retained its position among the leaders because its value is pegged to real usage, not pure speculation.
The key insight, for long-time observers, is simple: BNB tends to perform best after meaningful ecosystem upgrades-not hype. When Binance and BNB Chain deliver new infrastructure, new use cases, or better user experience, BNB will eventually reflect that value in its price action.
FAQs
1. What price did BNB start at?
BNB started at around 0.10 USD during its ICO in July 2017. It was initially launched as a utility token for trading-fee discounts on Binance and quickly gained traction as the exchange grew.
2. How much was BNB in 2017?
BNB traded between a low of 0.0961 USD and a high of 9.3186 USD. Its price surged during the late 2017 bull run thanks to Binance’s explosive growth and high trading volumes.
3. How much will BNB cost in 2030?
Long-term scenarios from various analysts place BNB in the 1,500 to 3,000 USD range by 2030 under favorable market conditions. Estimates vary depending on market adoption, regulatory environment, and growth of BNB Chain, but long-term projections remain generally bullish and highly speculative.
4. Can BNB hit 2000 dollars?
BNB could reach 2,000 USD if the market enters a strong institutional-led bull cycle. If opBNB adoption accelerates, ETF capital continues entering crypto, and BNB Chain maintains high on-chain activity, the 2,000 USD level becomes a possible long-term scenario. However, this is not a prediction or guarantee and should not be taken as financial advice.
| Disclaimer: The content on The CCPress is provided for informational purposes only and should not be considered financial or investment advice. Cryptocurrency investments carry inherent risks. Please consult a qualified financial advisor before making any investment decisions. |